H
Hania Luniak's…
Quick tools
K
/

Recents
More
Consumables & Reagents
Instruments & Equipment
Favorites
Spaces
Research & Development
Electronic Lab Notebook
Project Management
Inventory & Instruments
Consumables & Reagents
Instruments & Equipment
Health & Safety
Consumables & Reagents
Instruments & Equipment
Private
My To-Do List
Invite members
Help and Academy

Notebook
Search
Customize

Change cover
Reposition
🧬
EXP-001-011
Investigating Species-Specific Differences in Motor Neuron Differentiation
Investigating Species-Specific Differences in Motor Neuron Differentiation
Created by:

Last updated:
Today at 14:41
Reviewer:
Tags:
–

1. Introduction & Research Objective
Research Question
Why does motor neuron differentiation progress at different rates in different species?
How does protein stability influence the tempo of neural differentiation in mice and humans?
Hypothesis
The slower human developmental tempo is linked to increased protein stability, leading to prolonged motor neuron differentiation.
Differences in genomic sequences or signaling pathways do not account for interspecies developmental tempo variations.
Key Background Information
The same genetic regulatory program governs motor neuron differentiation in both species.
Motor neuron differentiation occurs in:
~3-4 days in mice
~2 weeks in humans
Protein degradation rates and cell cycle duration differ significantly between species.

📌 (Fig. 1. Comparison of neural tube development in mouse and human embryos. (A) Schema of mouse and human neural tube development. W, embryonic week.
2. Experimental Approach
2.1. In Vitro Differentiation of Motor Neurons
Cell Culture & Neural Induction
Embryonic Stem Cells (ESCs) from mouse (HM1 line) and human (H9 line) will be used.
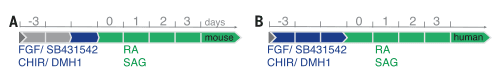
Cells will be differentiated into neuromesodermal progenitors by exposure to:
Mouse: 24-hour exposure to FGF, WNT, and SMAD inhibition.
Human: 72-hour exposure to the same factors.
Cells will be ventralized with:
100 nM retinoic acid (RA) and 500 nM smoothened agonist (SAG) to induce motor neuron differentiation.
📌 (Fig. 1. Comparison of neural tube development in mouse and human embryos. (A) Schema of mouse and human neural tube development. W, embryonic week.
2.2. Developmental Progression Analysis

Methods:
qPCR for gene expression analysis.
Immunostaining and microscopy for protein localization.
RNA sequencing (RNA-seq) for transcriptomic profiling.
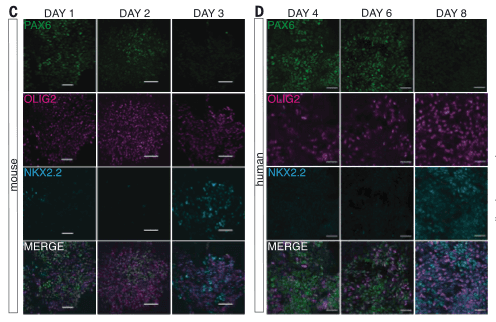
📌 Fig. 2. A global scaling factor for in vitro differentiation of mouse and human MNs. (C) Expression of neural progenitor markers (PAX6, OLIG2, NKX2.2) between days 1 and 3 in mouse MN differentiation. (D) Expression of NP markers (PAX6, OLIG2, NKX2.2) at days 4, 6, and 8 in human MN differentiation.

📌 Fig. 2. A global scaling factor for in vitro differentiation of mouse and human MNs. (E) Expression of MN markers (ISL1, HB9/MNX1) in mouse and human MNs. Mouse MNs can be detected by days 2 to 3, whereas human MNs are not detected until days 8 and 10. (F) HOXC6 expression in MNs characterized by ISL1 and TUBB3 expression at day 3 in mouse and at day 10 in human. In (C) to (F), scale bars are 50 mm.
2.3. Mechanistic Investigations
A. Protein Stability Analysis
Hypothesis: The slower differentiation in humans is due to increased protein stability.
Method: Pulse-chase labeling with L-azidohomoalanine (AHA) to track protein degradation over time.
Expected Outcome:
Human neural progenitors will have more stable OLIG2 and NKX6.1 proteins than mouse progenitors.

📌 Fig. 6. Protein decay and cell cycle account for the speed differences between species. (A) Normalized measurements of mouse and human NKX6.1, OLIG2, SOX1, and SOX2 from AHA pulse-chase experiments using AHA-labeled and purified proteins. Line and shaded areas show best exponential fit and 95% CIs (mouse n = 3; human n = 3 for OLIG2 and NKX6.1, n = 4 for SOX1 and SOX2).
B. Cell Cycle Analysis
Hypothesis: Slower human development correlates with a longer cell cycle.
Method: EdU pulse-labeling to measure the duration of the cell cycle in both species.
Expected Outcome:
Human progenitors have a longer cell cycle (~28 hours) vs. mouse progenitors (~11 hours).
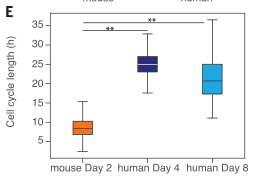
📌 Fig. 6. Protein decay and cell cycle account for the speed differences between species. (E) Cell cycle length estimations in mouse neural progenitors at day 2 and human neural progenitors at days 4 and 8. Boxplots indicate the 25th to the 75th interquartile range, and whiskers show values within 1.5 times the inter- quartile range of the 25th and 75th percentiles. For all plots, mouse data are colored orange and human data are blue. In (C) and (E), statistical significance (**) corresponds with <0.01 overlap between the distributions of parameter estimations
C. Computational Modeling of Gene Regulatory Networks
Goal: Use a mathematical model to predict the effect of protein stability changes on developmental pace.
Method:
A previously validated model of the mouse motor neuron network will be used.
Simulations will be run where protein half-lives are doubled to mimic human kinetics.
Expected Outcome:
The model should reproduce the 2.5-fold slower differentiation rate observed in human cells.
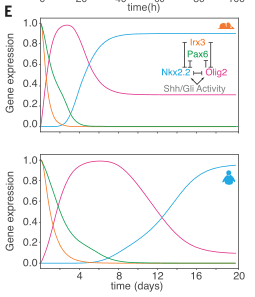
📌 Fig. 5. Protein stability in the GRN corresponds to tempo differences between species. Temporal dynamics of the computational model of the neural tube GRN in mouse (top), and the predicted human behavior (bottom), simulated by halving the decay rates of the proteins of the network. The inset diagram shows the cross repressive GRN comprising the transcription factors Pax6, Olig2, Nkx2.2, and Irx3 used to model ventral patterning of the neural tube.
3. Expected Outcomes & Impact
Key Predictions
✅ Increased protein stability correlates with slower motor neuron differentiation.
✅ The developmental tempo is independent of signaling sensitivity or genomic sequences.
✅ Mathematical models confirm that protein degradation influences differentiation speed.
Implications
🔬 Fundamental Biology: Provides insight into why different species develop at different rates.
🧬 Stem Cell Research: Helps optimize protocols for human motor neuron differentiation in regenerative medicine.
💊 Disease Modeling: Could explain species differences in neurodevelopmental disorders.
4. Figures & Graphics Summary

5. Conclusion
This experiment aims to uncover the molecular basis of species-specific developmental tempos. By demonstrating that protein degradation rates are a key factor, it opens new directions in developmental biology and biomedical applications.
6. Attachments
Biotechnology and Genetic Engineering using AI: A Review.pdf
2057.3KB
Biotechnology and Genetic Engineering using AI: A Review.pdf
2057.3KB
Biotechnology and Genetic Engineering using AI: A Review.pdf
2057.3KB